Data
The dataset comprises roughly 9,000 samples collected over the ground from the Makenzie Rock Mountains in the NWT. Location maps for the concentrations of lead, zinc, and nickel are presented in Figure 2, alongside with histograms displaying their concentrations after log transformation to account for their high positive skewness.
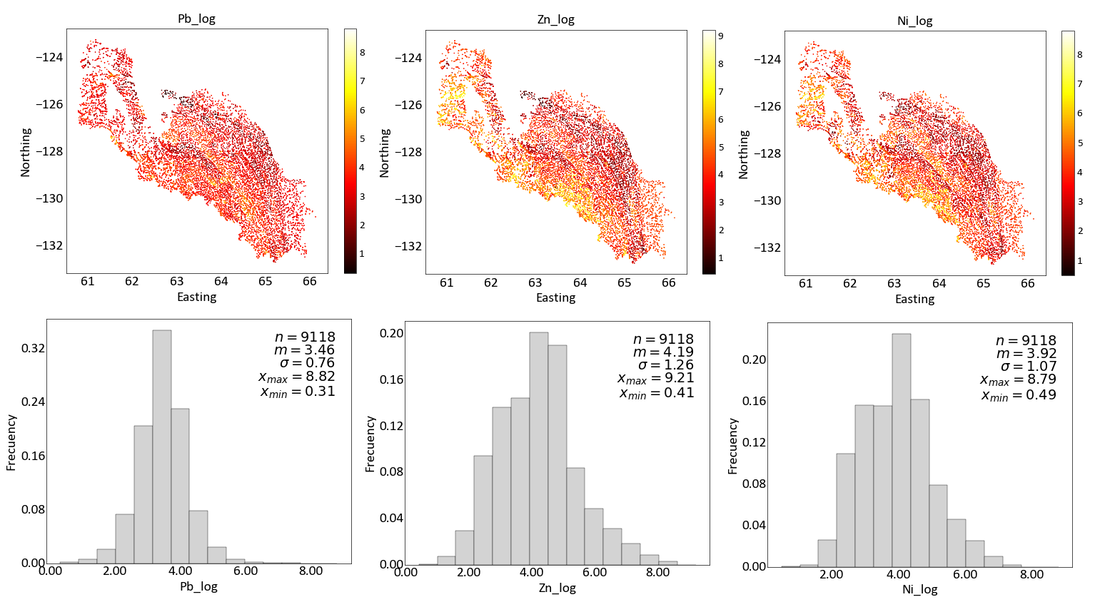
Figure 2: Location Map & Histogram of the variables.
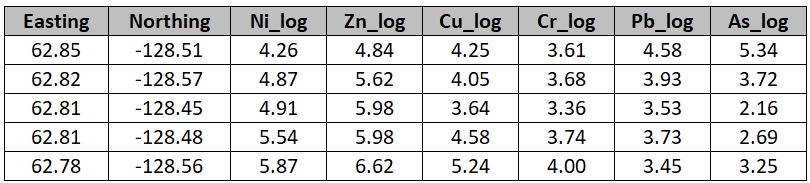
Table 1 presents the head of the data table containing the variables considered in this study.
Table 1: Variables considered in this study (after log transformatin the sufix _log was added to their names.
Also, we checked the multivariate statistics of the continuous variables and the correlation matrix is presented in Figure 3.

Figure 3: Correlation matrix for the variables.
Dimensionality Reduction
As the data set consists of six continuous variables, we performed a Principal Component Analysis to identify the variable that is mostly correlated with PC1 which will be used in the GC method. Figure 4 shows the biplot. In that case, the variable chosen was Zn_log, which is more correlated with PC1, although it is an inverse correlation. PC1 represents 70% of the total variance, and PC2 12%.
As the data set consists of six continuous variables, we performed a Principal Component Analysis to identify the variable that is mostly correlated with PC1 which will be used in the GC method. Figure 4 shows the biplot. In that case, the variable chosen was Zn_log, which is more correlated with PC1, although it is an inverse correlation. PC1 represents 70% of the total variance, and PC2 12%.

Figure 4: Biplot.
